The NHS pension is complicated. It’s time to stop guessing.
A plain-English report tailored to your own figures: your NHS pension, State Pension and savings, projected to your State Pension age and shown against the income you want.
£49
- Report within 5 working days of payment
- 30-day refund
- Information, not advice
CASOMO
- Agenda for Change
- Doctors & dentists
- Very senior managers
- England, Scotland, Wales & Northern Ireland
Why we built it
We had questions about our own NHS pensions, and so did the colleagues we talked to. We joined the NHS to care for others, not to pick apart a pension. Understanding yours isn’t materialism: it’s the same care, turned to your own future.
Your statement shows what you’ve built up. It doesn’t add your State Pension or savings, set them against the income you want, or show what other retirement dates, fewer hours or additional pension would do. Your Wealth Report does, in plain English, so you can make your own decisions.
Your report
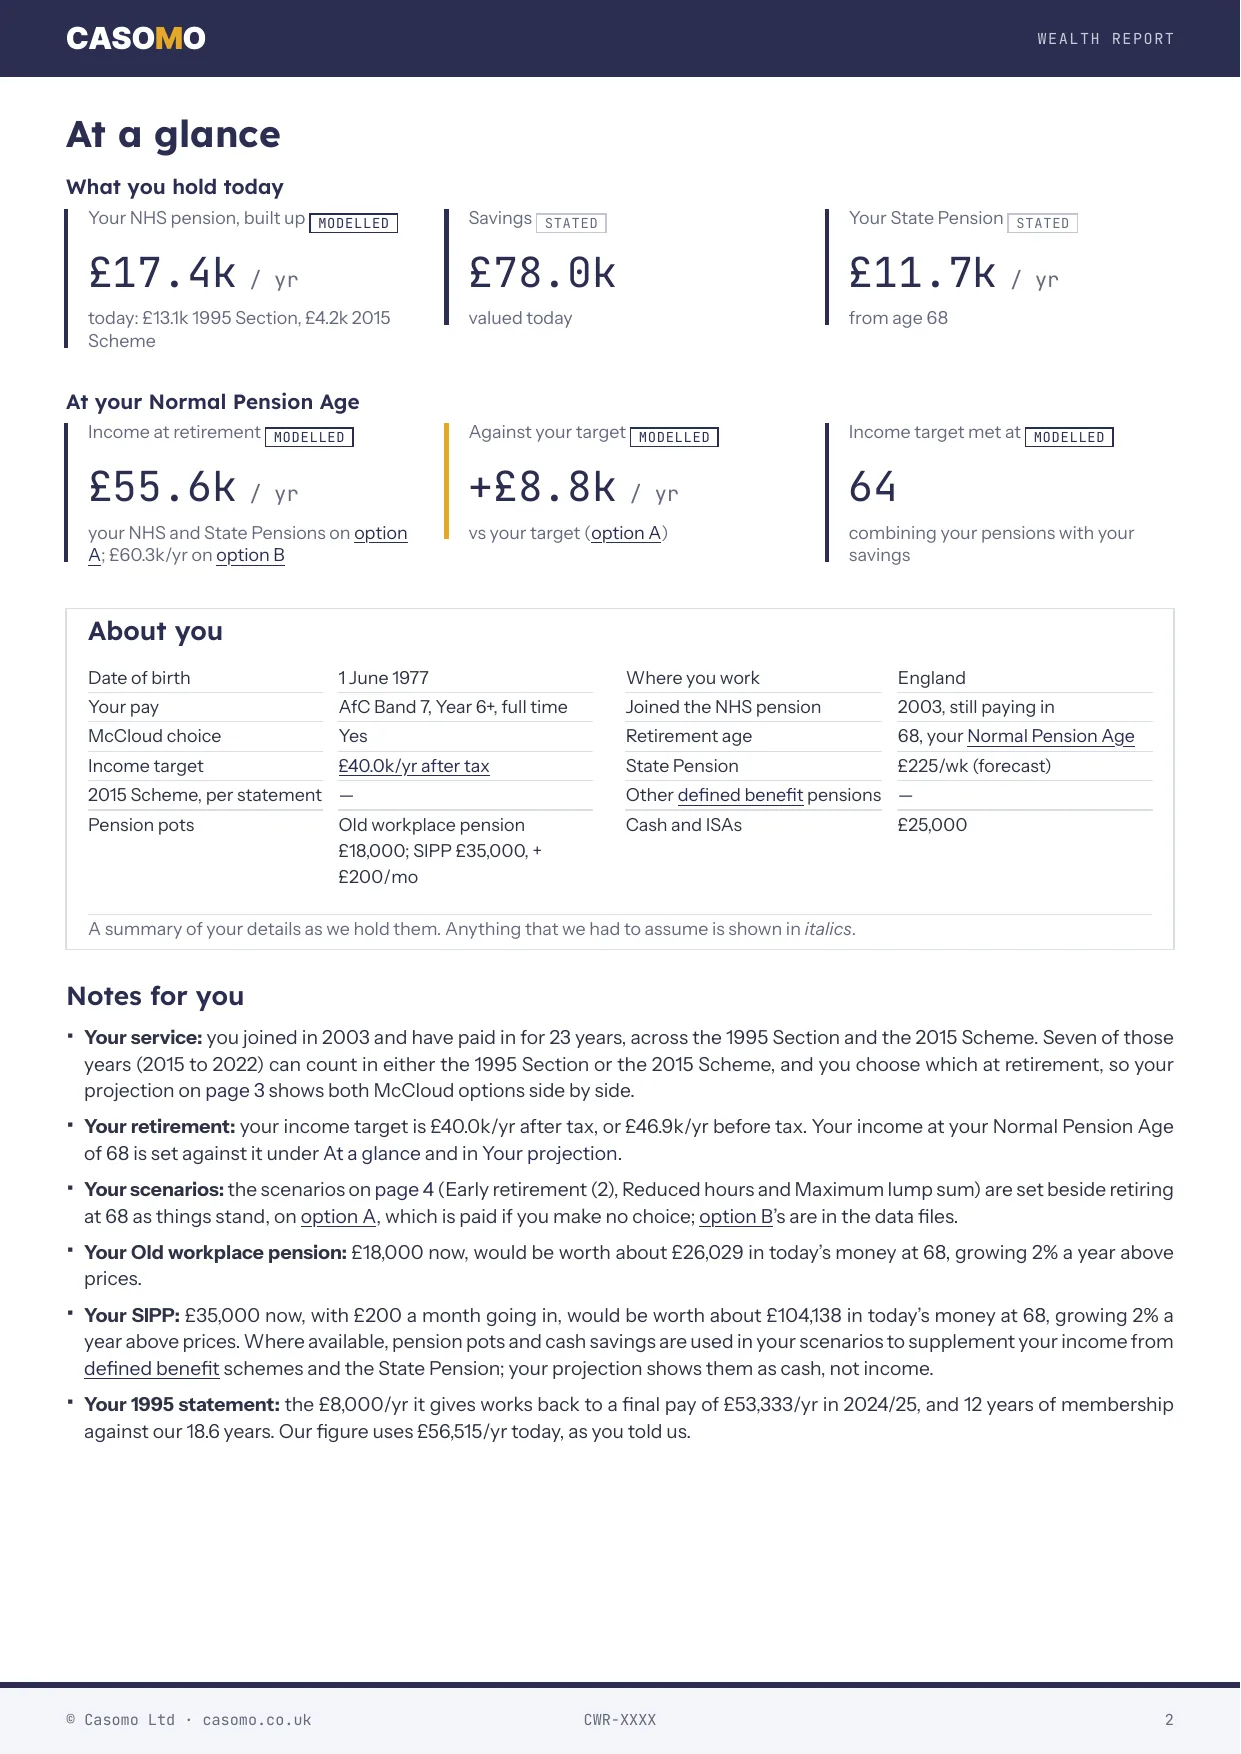
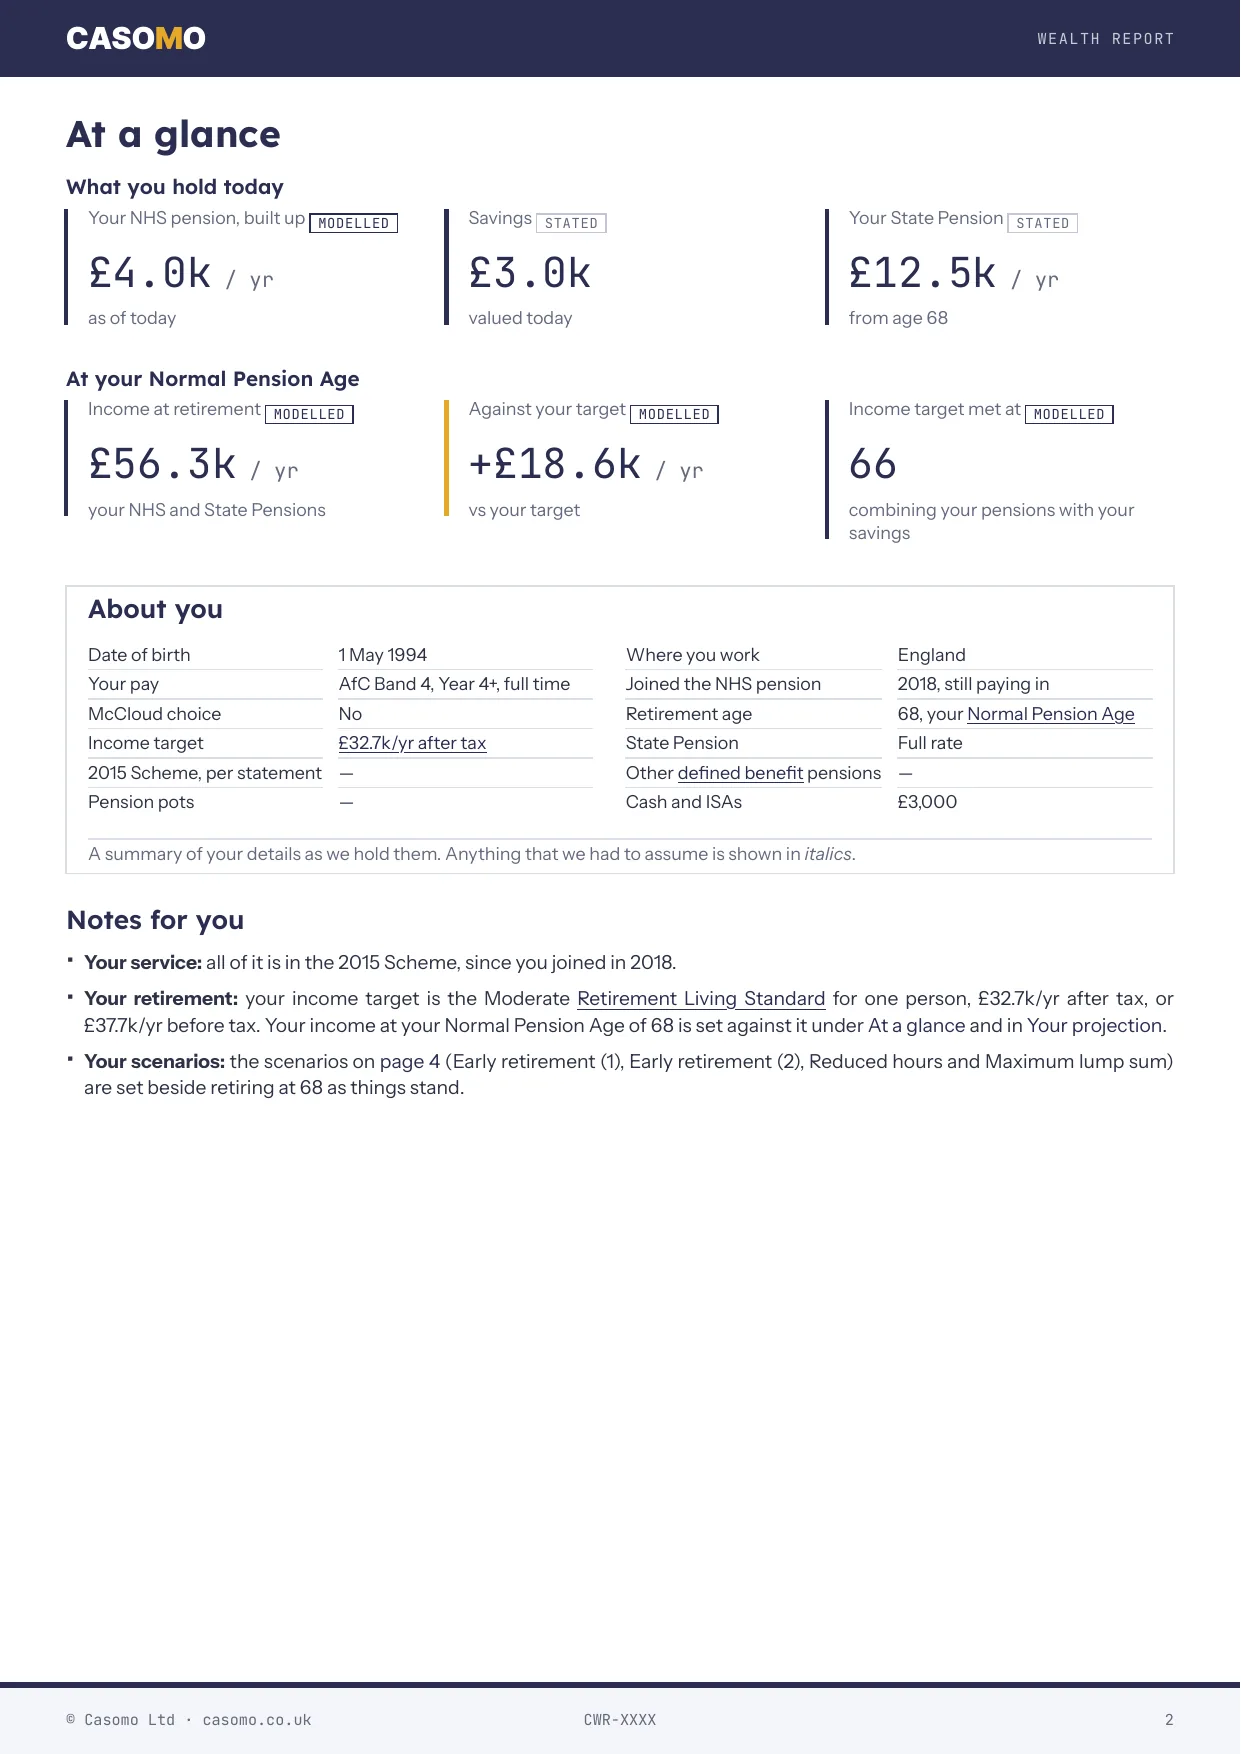
The first page of your report gives you your picture at a glance: what you hold today, what your NHS and State Pensions come to at your State Pension age, how that compares with the income you want, and the first age you’d reach it. Name that income yourself, or pick one of the Pensions UK Retirement Living Standards.
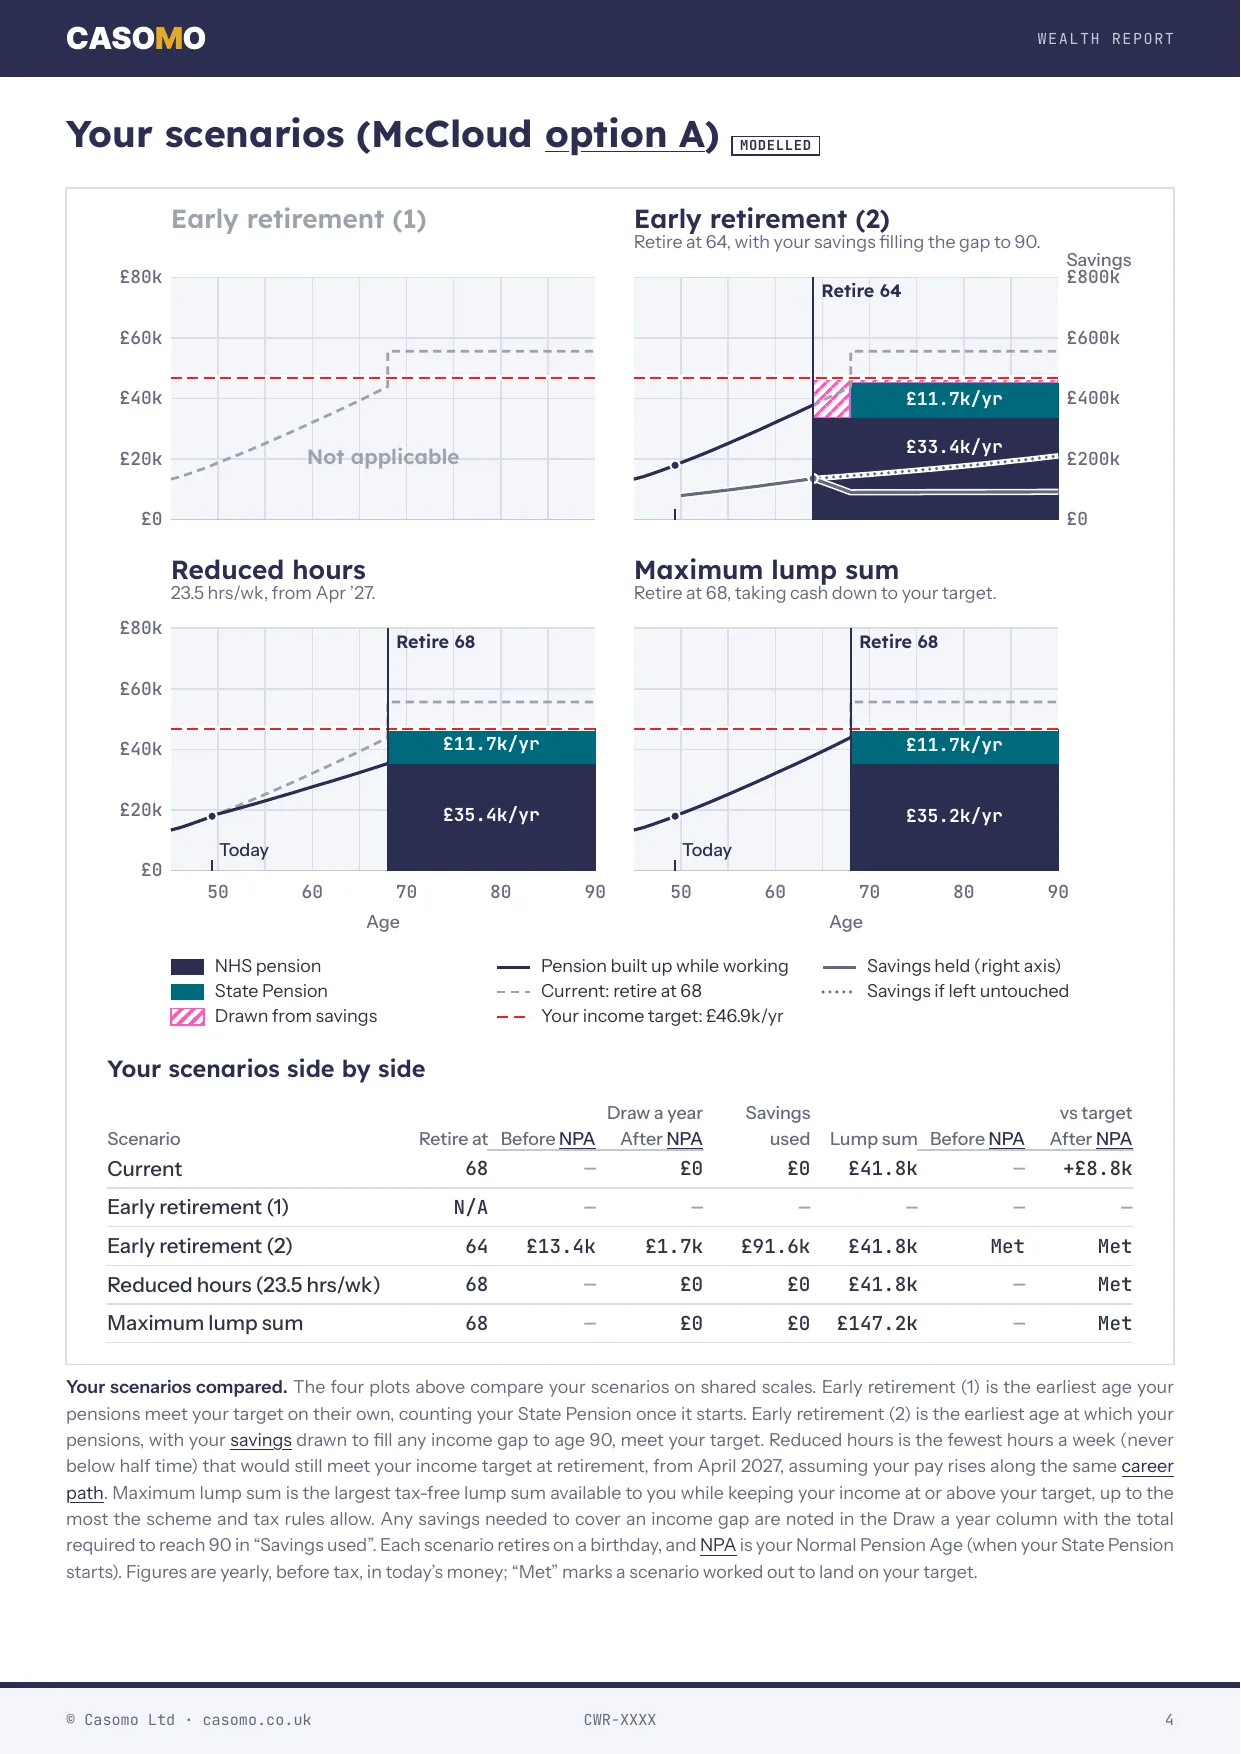
Where your pensions come out above your target, the report prices retiring earlier, on your pensions alone or drawing on your savings, working fewer hours, and taking the most cash while keeping your target. Where they come out below it, it prices retiring later, earning more and buying additional pension. Each is drawn year by year to age 90 on the same scales. None is recommended.
Service in the 1995 or 2008 Section is projected beside your 2015 Scheme pension, each to its own rules. If you have the McCloud choice for your service from 2015 to 2022, both options are shown side by side, and neither is chosen for you.
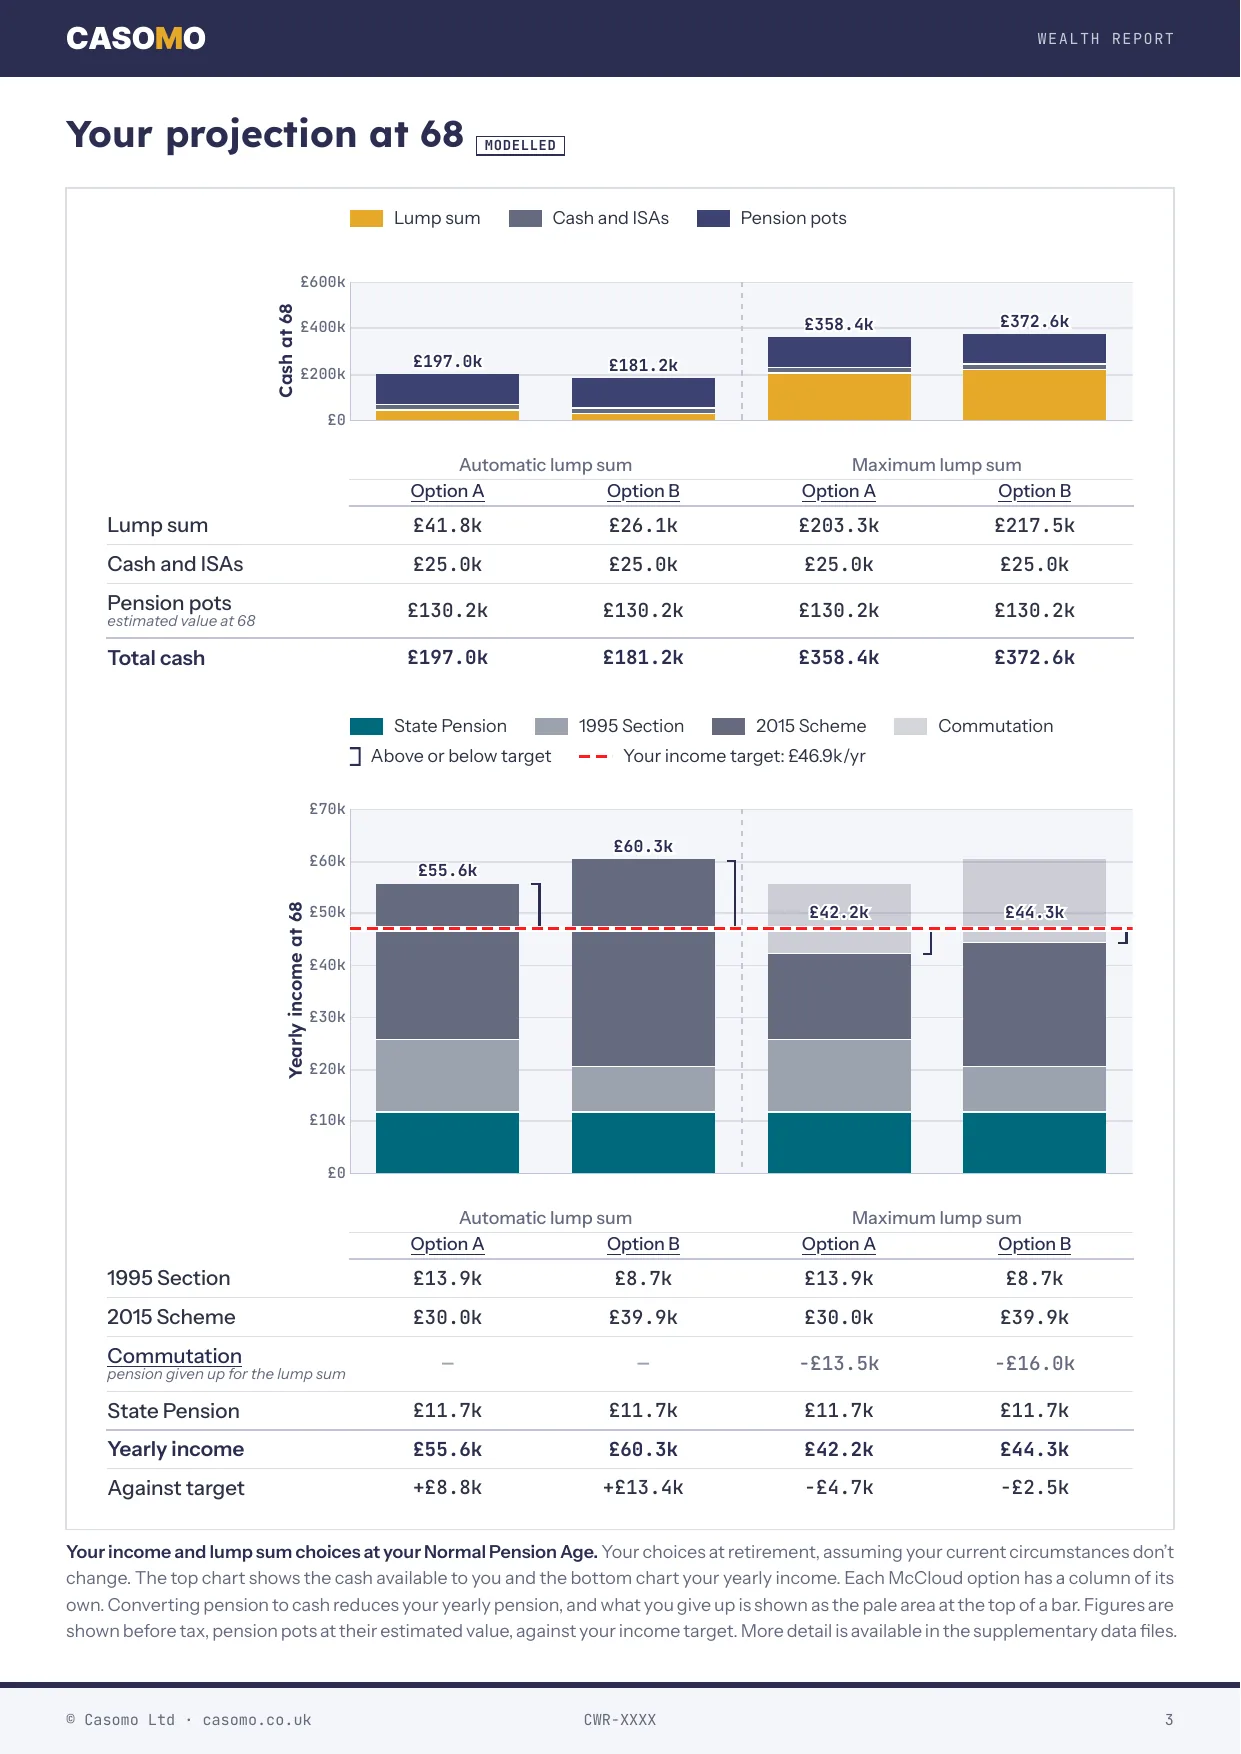
Your cash and your yearly income are shown with the most the rules allow you to take as a lump sum, beside the lump sum the 1995 or 2008 Section pays automatically where you have one. The pension you would give up for the extra cash is drawn on the same chart, so you see what it costs each year.
We calculate to the published scheme rules and factor tables, and our assumptions are listed in your report. Your NHSBSA pension statement, where it projects your pension, holds your pay where it is today. Your Wealth Report follows your pay as it’s expected to rise: up your pay scale, then in line with the Government Actuary’s own figures for how NHS pay grows over a career. So the two can differ, and your report says why. It comes with the workings too, as data files: the working behind its figures, your pension built up year by year and each scenario to age 90, so you can go through any figure yourself in a spreadsheet.
See a sample
Have a look at these sample reports for fictional NHS staff in real roles, at different bands, ages and stages of their careers. Their figures are illustrative. Pick the one whose situation looks most like yours to see what your own report would show.
How it works
Answer the questionnaire
Tell us about your NHS service: when you joined, your pay and hours, and any gaps or time you stopped paying in. Then the figures from your Annual Benefit Statement, your State Pension forecast, any pensions or savings outside the NHS, and the income you’d like in retirement. It takes about 10 minutes.
We read your answers
When you submit, you and we are each emailed a copy of your answers. We read them to check we can build your report. If something’s missing or doesn’t add up, we reply to ask, and you can correct an answer the same way. Nothing is charged at this stage.
Pay the £49 invoice
Once your answers check out, we email you an invoice from Stripe, our payment provider. Pay it online when you’re ready, within 30 days. If you change your mind, just tell us. Unpaid invoices are void after 30 days and your answers are deleted.
Get your report in 5 working days
Your report is prepared with care and arrives as a PDF you open with your date of birth, with its data files. It recommends no date, scheme option or lump sum.
If you’re not completely satisfied after receiving your report, tell us within 30 days and we’ll refund you in full. No questions.